The Bakery Treats
This listing has been marked as closed.
Business Contact
baseball Christmas party
unknownBusiness Description
We prioritize using fresh, authentic ingredients from local suppliers and traditional methods to deliver high-quality baked goods. Our focus is on ensuring customer satisfaction and providing excellent customer service. Established in 2015, The Bakery Treats is committed to making your taste buds happy.
Industry
Food » Grocery store
Food » Grocery store
Engaged in:
Cupcake Shop, Pie Shop, Dessert Shop, Wedding Bakery, Grocery store
Cupcake Shop, Pie Shop, Dessert Shop, Wedding Bakery, Grocery store
ISIC Codes
1071, 4711, 4721
NAICS Codes
3118, 445110
1071, 4711, 4721
NAICS Codes
3118, 445110
Questions & Answers
Q1
Where is The Bakery Treats located?
The Bakery Treats is located at Spring, TX 77388.Q2
What days are The Bakery Treats open?
This listing has been marked as closed.
The Bakery Treats is open Mon–Sat 9 AM–5 PM; closed Sun.Q3
Are there other contacts associated with The Bakery Treats?
We have 2 additional contact(s) for The Bakery Treats. They include: Veronica & daughters.Q4
What is the web address (URL) for The Bakery Treats?
The website for The Bakery Treats is www.thebakerytreats.com.Similar Companies Nearby
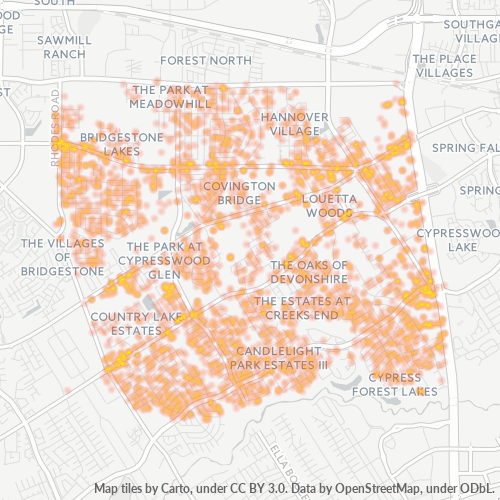
Businesses in Zip Code 77388
Businesses in 77388: 7,758
Population: 44,052
Categories
Shopping: 18%
Home Services: 12%
Professional Services: 11%
Other: 59%
Price
Moderate: 49%
Inexpensive: 43%
Expensive: 5%
Very Expensive: 3%
Other: 0%
Area Codes
281: 76%
832: 16%
713: 6%
Other: 2%
Neighborhoods
Bridgestone: 7%
Country Lake Estates: 7%
Cypresswood: 8%
Cypresswood Court: 7%
Enchanted Oaks: 7%
Middlecoff: 10%
Other: 53%
Stats and Demographics for Zip Code 77388
Race
White: 80%
Hispanic or Latino: 10%
Black Or African American: 4%
Asian: 3%
American Indian Or Alaskan Native: 0%
Native Hawaiian & Other Pacific Islander: 0%
Other: 3%
Gender
Female: 51%
Male: 49%
Other: 0%