Pie for Providers
Contact Information
Phone: (773) 217-0743
Hours: Show
Email: [email protected]
Facebook Profile: Visit
Twitter Feed: Visit
Google Maps: Visit
Instagram: Visit
LinkedIn Profile: Visit
Edit: Edit or Remove
Business Description
Pie for Providers offers a solution to help child care providers and center administrators streamline billing for the federal government child care assistance program and manage attendance more effectively. This helps to reduce administrative burdens and maximize income, ultimately increasing access to quality child care in their communities.
Revenue: USD 98,363
Industry
Shopping
Shopping
Engaged in:
Software Company
Software Company
ISIC Codes
4741
NAICS Codes
443142
4741
NAICS Codes
443142
Questions & Answers
Q1
What is the phone number for Pie for Providers?
The phone number for Pie for Providers is (773) 217-0743.Q2
Where is Pie for Providers located?
Pie for Providers is located at 4813 N Seeley Ave, Chicago, IL 60625, Illinois.Q3
What days are Pie for Providers open?
Pie for Providers is open Mon–Fri 9 AM–5 PM; closed Sat–Sun.Q4
Is there a primary contact for Pie for Providers?
You can contact Pie for Providers by phone using number (773) 217-0743.Q5
What is the web address (URL) for Pie for Providers?
The website for Pie for Providers is www.pieforproviders.com.Q6
What are the annual sales for Pie for Providers?
Pie for Providers has annual sales of approximately USD 98,363.Similar Companies Nearby
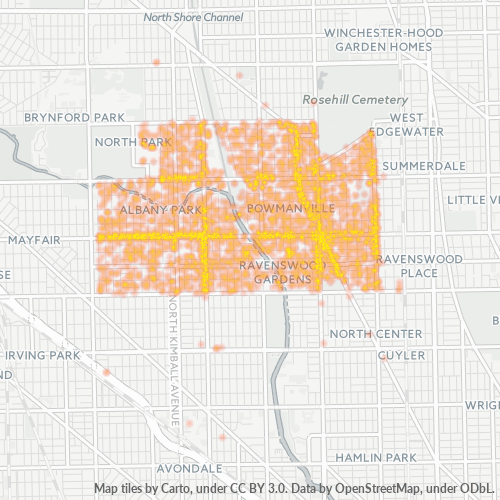
Businesses in Zip Code 60625
Businesses in 60625: 10,931
Population: 77,062
Categories
Medical: 18%
Shopping: 18%
Restaurants: 12%
Other: 52%
Price
Inexpensive: 50%
Moderate: 41%
Expensive: 7%
Very Expensive: 3%
Other: 0%
Area Codes
773: 89%
312: 6%
Other: 6%
Neighborhoods
Albany Park: 29%
Budlong Woods: 12%
Lincoln Square: 45%
North Park: 7%
Other: 6%
Stats and Demographics for Zip Code 60625
Race
White: 42%
Hispanic or Latino: 29%
Asian: 13%
Black Or African American: 3%
American Indian Or Alaskan Native: 0%
Other: 13%
Gender
Male: 51%
Female: 49%
Other: 0%