J P Harrington Bisceglia
Contact Information
Business Description
J.P. Harrington Bisceglia is an accomplished attorney with a focus on insurance coverage and bad-faith litigation. Recognized as a Super Lawyers Rising Stars selectee since 2014 and holding the prestigious AV-Preeminent® Peer Review Rating™ by Martindale-Hubbell®, she has also achieved the designation of Associate Fellow of the Litigation Counsel of America, a distinction awarded to a select few lawyers in the country.
Industry
Professional Services
Professional Services
Engaged in:
Insurance Attorney
Insurance Attorney
ISIC Codes
6910
NAICS Codes
5411
6910
NAICS Codes
5411
Questions & Answers
Q1
What is the phone number for J P Harrington Bisceglia?
The phone number for J P Harrington Bisceglia is (602) 792-1700.Q2
Where is J P Harrington Bisceglia located?
J P Harrington Bisceglia is located at 2700 N Central Ave #1200, Phoenix, AZ 85004.Q3
What days are J P Harrington Bisceglia open?
J P Harrington Bisceglia is open Mon–Fri 8:30 AM–5 PM; closed Sat–Sun.Q4
Is there a primary contact for J P Harrington Bisceglia?
You can contact J P Harrington Bisceglia by phone using number (602) 792-1700.Q5
What is the web address (URL) for J P Harrington Bisceglia?
The website for J P Harrington Bisceglia is www.cdslawfirm.com.Similar Companies Nearby
Additional Businesses at this Address
2700 N Central Ave #1200, Phoenix, AZ 85004
Aguirre, John, JD
Business at this address
See more businesses at this addressBusiness at this address
Businesses in Zip Code 85004
Businesses in 85004: 13,775
Population: 6,280
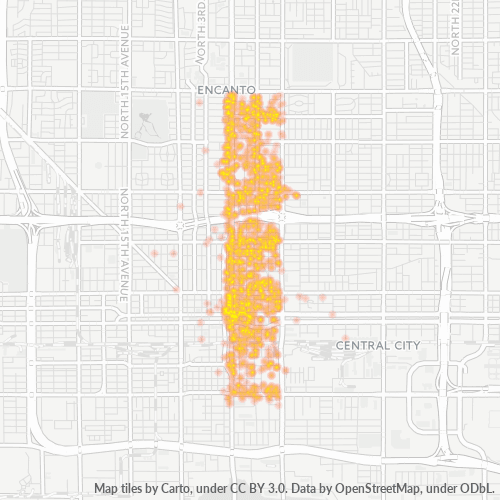
Categories
Professional Services: 32%
Medical: 16%
Other: 52%
Price
Moderate: 55%
Inexpensive: 31%
Expensive: 12%
Very Expensive: 2%
Other: 0%
Area Codes
602: 91%
480: 6%
Other: 3%
Neighborhoods
Central City: 56%
Encanto Village: 27%
Other: 17%
Stats and Demographics for Zip Code 85004
Race
White: 48%
Hispanic or Latino: 32%
Black Or African American: 4%
American Indian Or Alaskan Native: 4%
Asian: 1%
Native Hawaiian & Other Pacific Islander: 0%
Other: 12%
Gender
Male: 56%
Female: 44%
Other: 0%