Chae, Hung Yeol, MD
Contact Information
Phone: (732) 607-9090
Phone: (732) 442-3700
Phone: (732) 826-4177
Fax: (732) 607-1160
Edit: Edit or Remove
Business Description
Chae, Hung Yeol, MD is located in Englewood Cliffs, New Jersey, and was founded in 2019. At this location, Chae, Hung Yeol, MD employs approximately 6 people. Annual sales for Chae, Hung Yeol, MD are around 80,535.
Employees: 6
Revenue: 80,535
Founded: 2019
Industry
Medical » Physicians and surgeons
Medical » Physicians and surgeons
Engaged in:
Medical Office, Physicians and surgeons
Medical Office, Physicians and surgeons
ISIC Codes
8620
NAICS Codes
621
8620
NAICS Codes
621
Questions & Answers
Q1
How long has Chae, Hung Yeol, MD been in business?
Chae, Hung Yeol, MD has been in business for around 7 years.Q2
What is the phone number for Chae, Hung Yeol, MD?
The phone number for Chae, Hung Yeol, MD is (732) 607-9090.Q3
How big is Chae, Hung Yeol, MD?
Chae, Hung Yeol, MD generates approximately 80,535 in revenue annually, and employs around 6 people at this location.Q4
Where is Chae, Hung Yeol, MD located?
Chae, Hung Yeol, MD is located at 400 Sylvan Ave, Englewood Cliffs, NJ 07632.Q5
Is there a primary contact for Chae, Hung Yeol, MD?
You can contact Chae, Hung Yeol, MD by phone using number (732) 607-9090.Q6
What are the annual sales for Chae, Hung Yeol, MD?
Chae, Hung Yeol, MD has annual sales of approximately 80,535.Q7
How many people are employeed at Chae, Hung Yeol, MD?
Chae, Hung Yeol, MD has around 6 employees at this location.Similar Companies Nearby
Additional Businesses at this Address
400 Sylvan Ave, Englewood Cliffs, NJ 07632
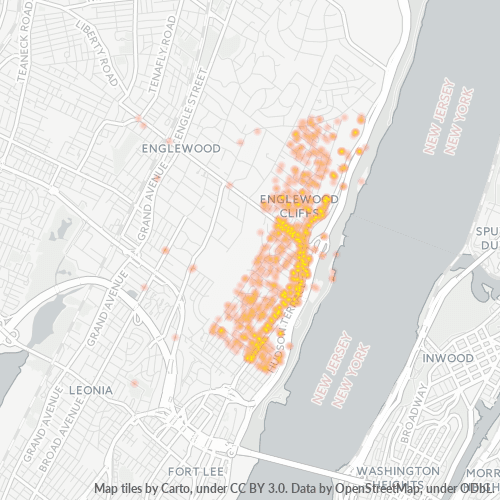
Businesses in Zip Code 07632
Businesses in 07632: 4,047
Population: 5,445
Categories
Professional Services: 28%
Medical: 16%
Shopping: 13%
Other: 43%
Price
Moderate: 53%
Expensive: 29%
Inexpensive: 13%
Very Expensive: 5%
Other: 0%
Area Codes
201: 96%
Other: 4%
Stats and Demographics for Zip Code 07632
Race
White: 65%
Asian: 29%
Hispanic or Latino: 5%
Black Or African American: 1%
Other: 1%
Gender
Female: 53%
Male: 47%
Other: 0%